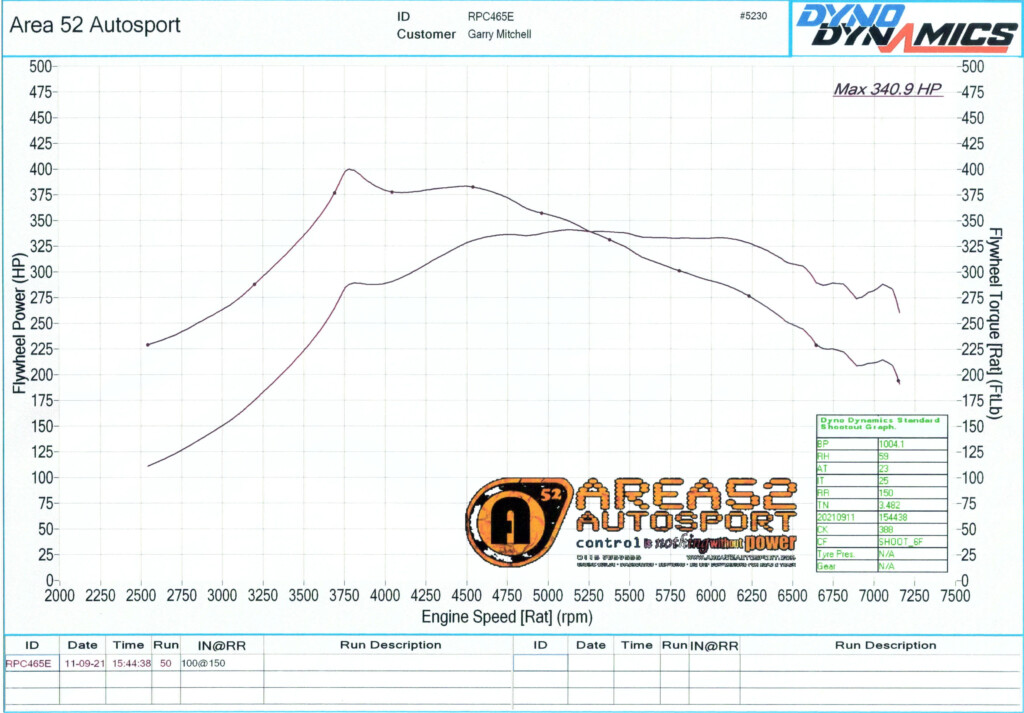
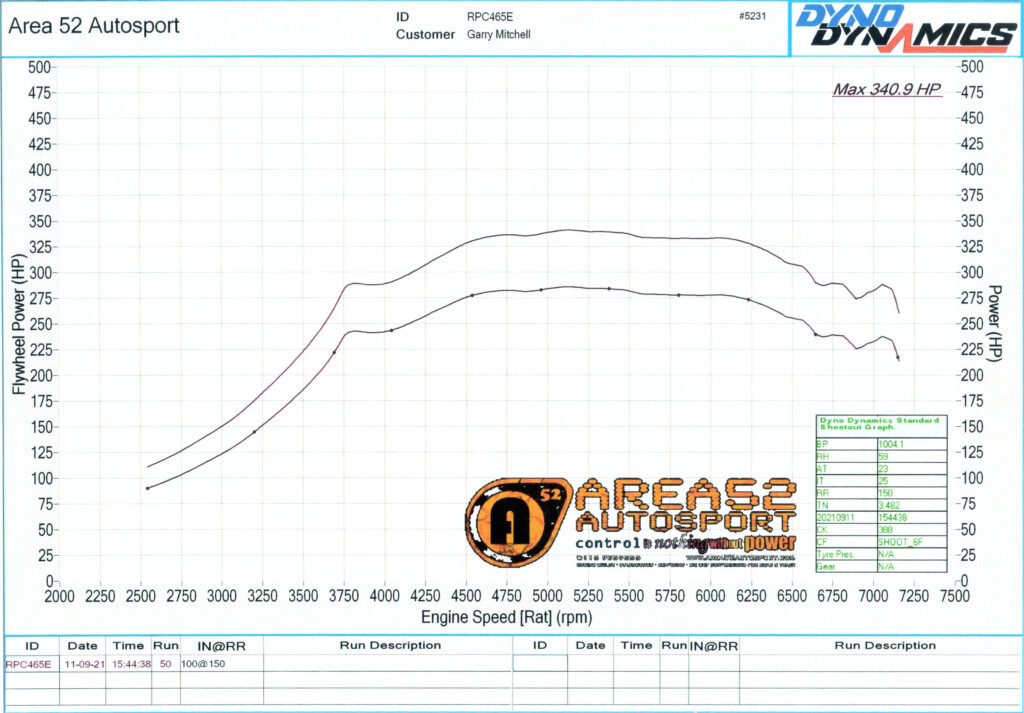
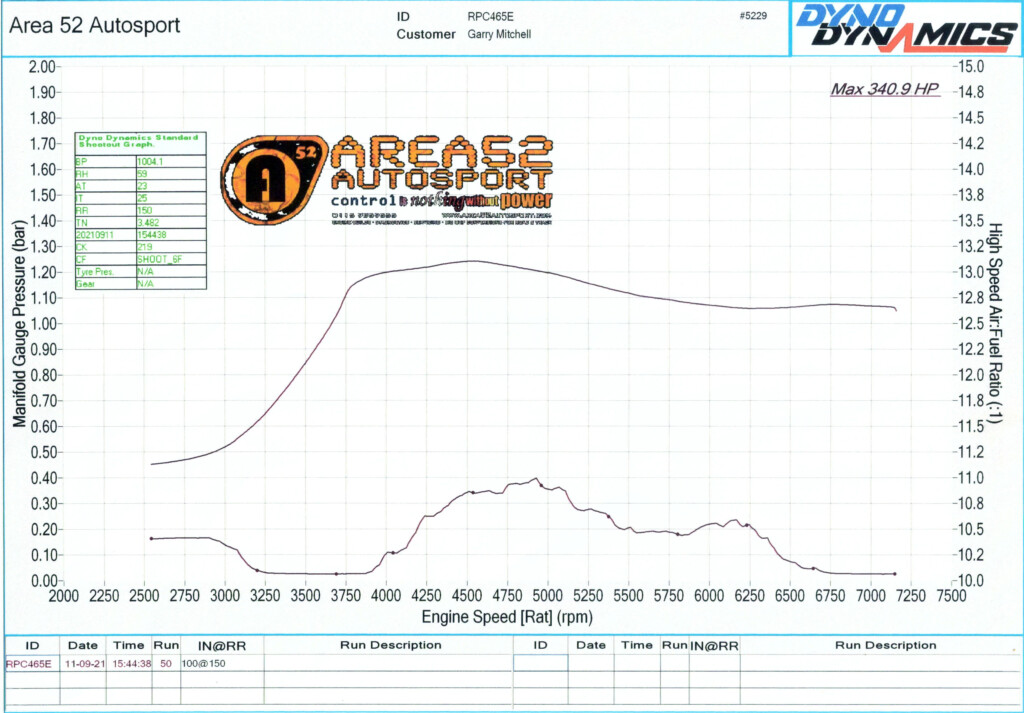
Hopefully you’ve all seen the last video, where these were flashed up on screen. Thought you’d like to have a closer look at the results of the power run I managed to video.
As I said in the video, this was just a very quick rough fiddle of the power area as I ran out of time on the dyno, nowhere near finished with the tuning – but even with the massive overfuelling, high inlet air temperature and no timing changes, the power figure is still pretty impressive, hopefully a bit more still to be eeked out of it!